everyday metrics
create and share dashboards
Create dashboards in minutes, and share them with users on any device
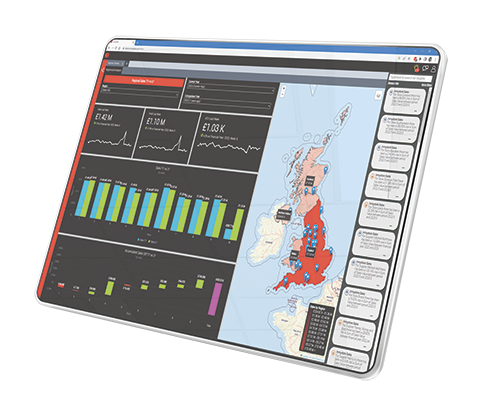
inmydata allows business users to create responsive dashboards in minutes. Dashboards render clearly and are easy to navigate on mobile and desktop devices. Add charts, maps, grids and gauges, apply filters and drill downs all with a few clicks to create and share the perfect view of your data across your organisation.
Adapt effortlessly to periods of disruption
Year on year comparisons can be a challenge when the previous year’s trading was disrupted. inmydata’s sophisticated calendar functionality makes it simple to compare any year to any year, allowing your organisation to adapt effortlessly to periods of disruption.
Explore the data behind any chart or metric
Sometimes you need to know what’s behind a chart or metric to understand it. That’s why inmydata lets you freely explore the data behind every object. Choose any dimension to drill into, add, edit or remove any filters, on your desktop, laptop, tablet or smartphone.
Publish dashboards to your entire organisation with a single click
Users can publish dashboards with a single click, allowing colleagues anywhere in the world access from their desktop, tablet or smartphone. Dashboards are automatically updated as new data is uploaded, so staff are always working from the latest available information.


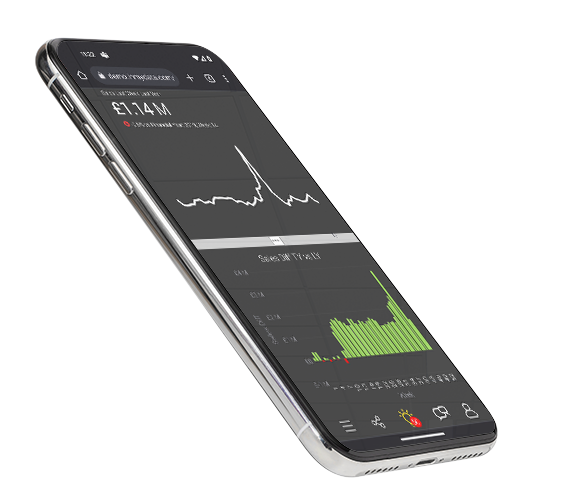
Responsive dashboards that are clear on any device
inmydata employs responsive design so dashboards are always clear and easy to navigate, whatever device you use to access them.
A few Numbers
Experience and innovation in analytics
request a demo
We think inmydata is fantastic, but it's your opinion that counts. If you have a spare half hour, we'd love to show you the product in action. Just click the button below, fill out a few details and we'll be in touch to arrange a demo at your convenience.

